


Visualize Soracom Query Results in Soracom Lagoon
You can visualize Soracom Query results in Soracom Lagoon 3. In this guide, we'll visualize the results that were generated in Show Connection Trends using Query.
Prerequisites
- You must be subscribed to a Soracom Query plan. For details, see Plan Management.
- You must be subscribed to a Soracom Lagoon plan. For details, see Subscribe to Lagoon.
Step 1: Create a New Dashboard and Panel
-
Sign in to the Lagoon console and click Dashboards icon > New > New Dashboard.
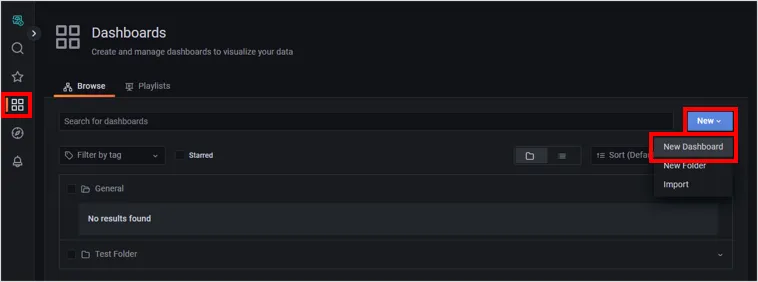
A new dashboard named "New dashboard" will be created.
-
Click Add a new panel.
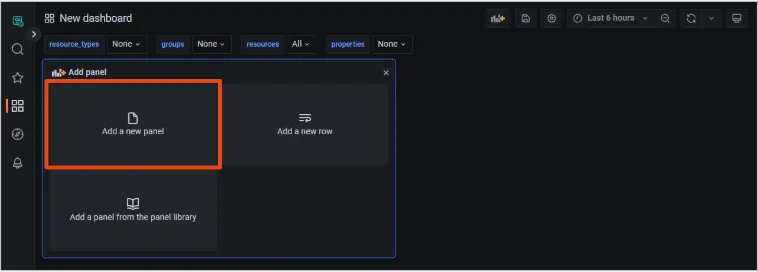
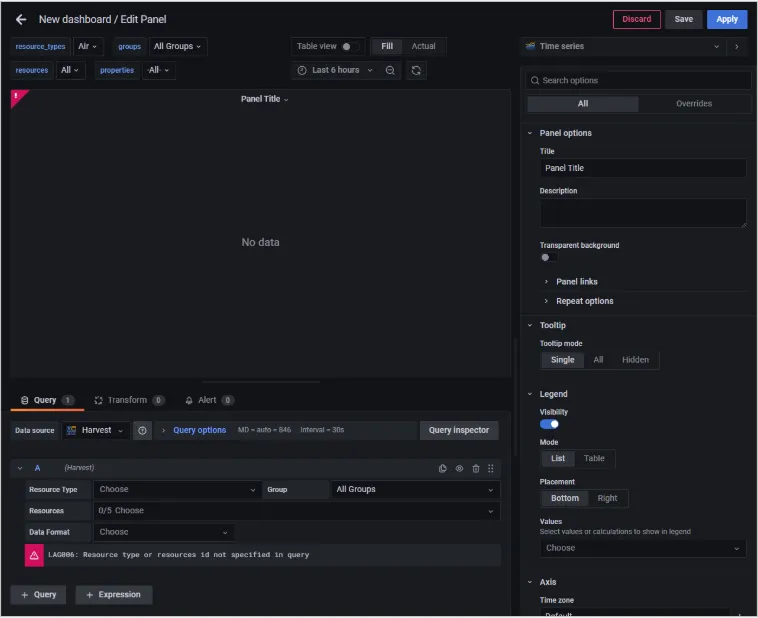
A panel will be created and the "Edit Panel" screen will appear.
-
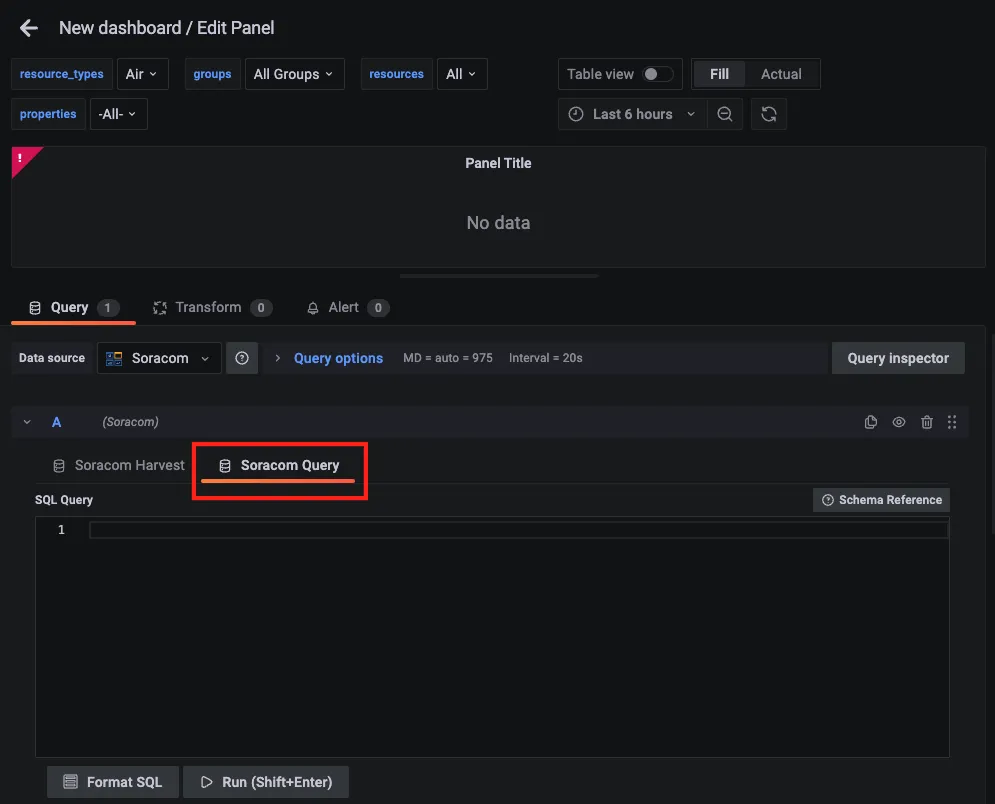
Select Soracom Query from the Query tab.
-
Enter the SQL query.
For details on the query, refer to Create a Query with SQL Assistant.
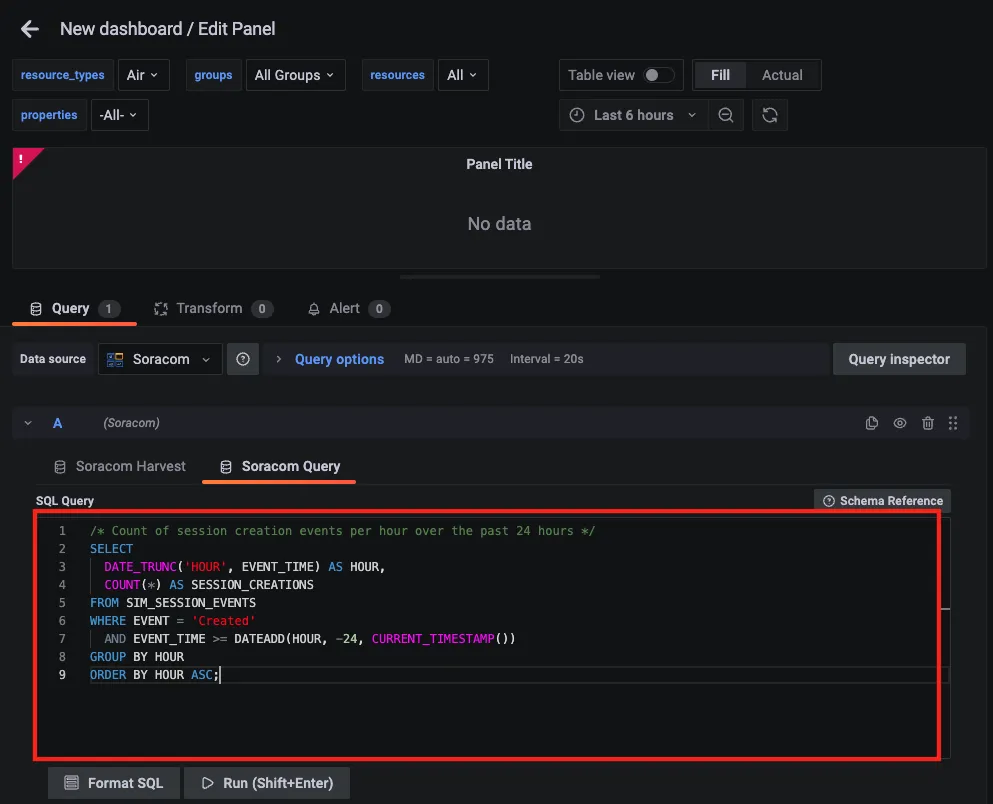
! SQL character limit: The maximum length for SQL queries is 3,000 characters. If your query exceeds this limit, an error will occur. Reduce the number of characters to stay within the limit.
-
Click Run or press Shift + Enter to execute the SQL query.
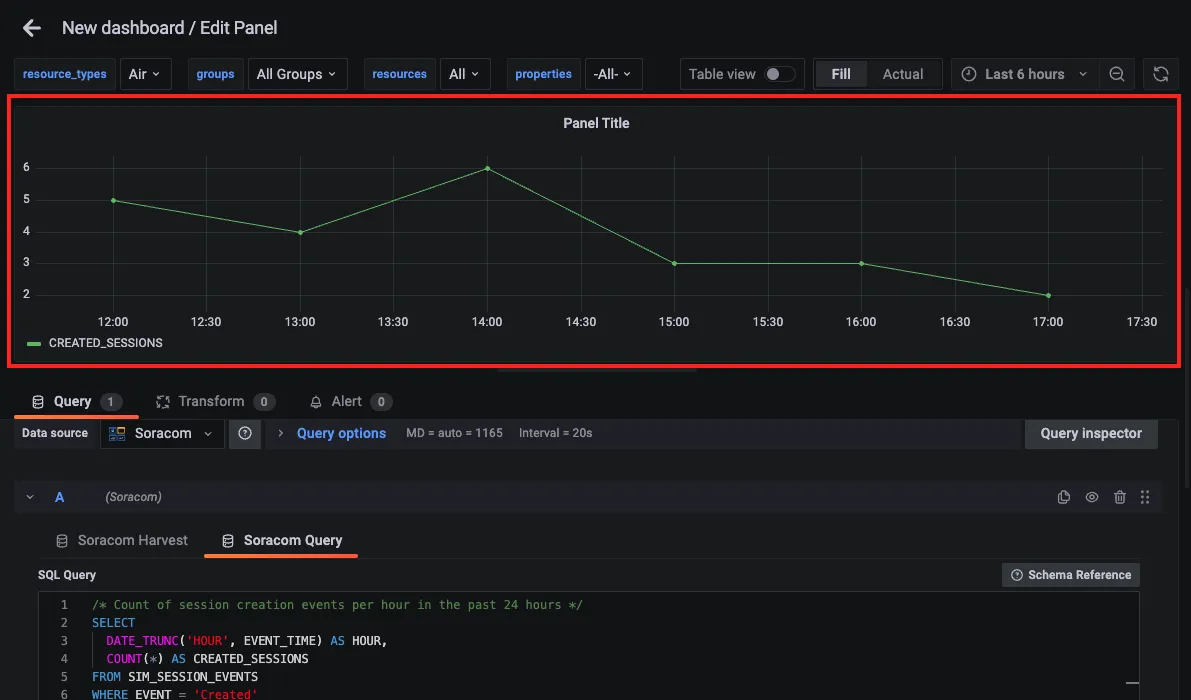
API calls are counted: When executing Soracom Query from Soracom Lagoon, API calls count toward your plan's total usage. Some plans limit the number of API calls or charge fees based on usage. For details, see View Usage.
Time range limitation: The time range specified in your SQL query may be limited by the time range set in the panel. For example, if your query retrieves data for the past 2 hours but the panel time range is set to 1 hour, only 1 hour of data will be displayed.
No Harvest Data export charges: Retrieving data from Soracom Harvest Data using Soracom Query does not incur export charges. This applies even if the Harvest Data retention period extension option is enabled.
Step 2: Set the Panel Title
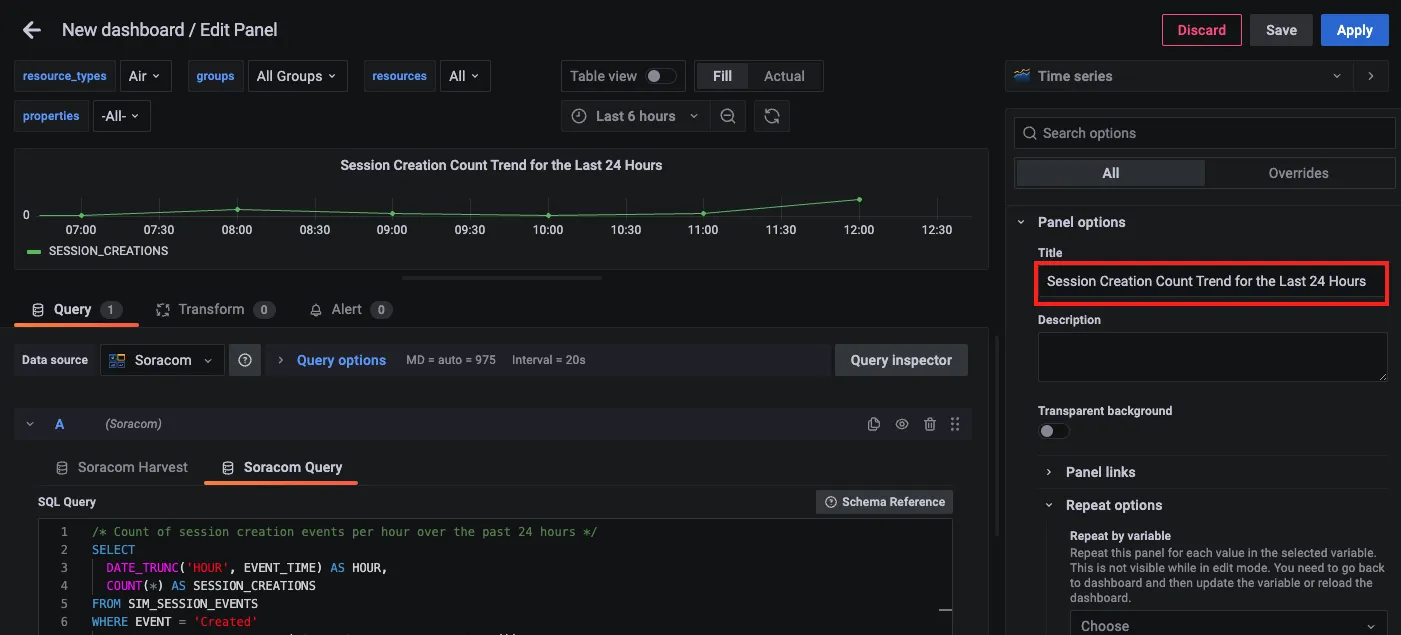
By default, "Panel Title" is displayed.
-
Click All > Panel options and enter "Session Creation Count Trend for the Last 24 Hours" in the Title field.
Step 3: Save the Dashboard
-
Click Apply on the "Edit Panel" screen.
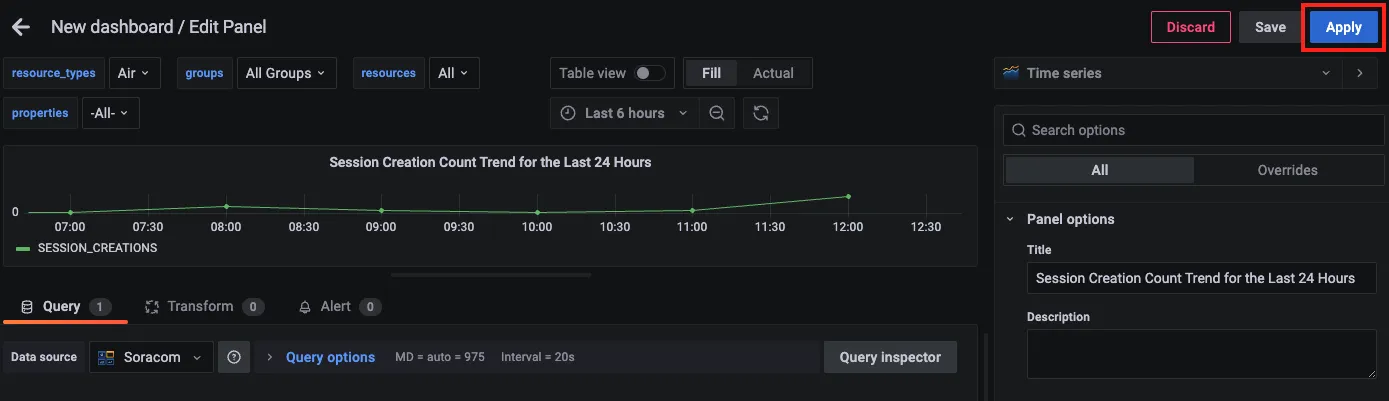
You'll return to the Dashboard screen.
-
Click the Save dashboard button.
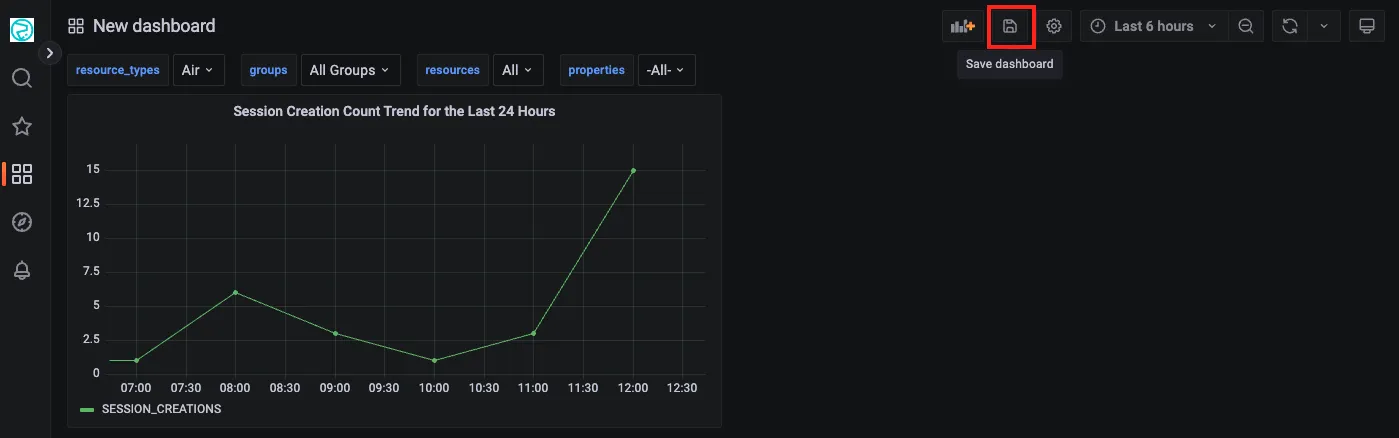
The Save dashboard screen will appear.
-
Enter a name for the Dashboard (e.g., Session Creation Count Trend Dashboard) in the Dashboard name field and click Save.
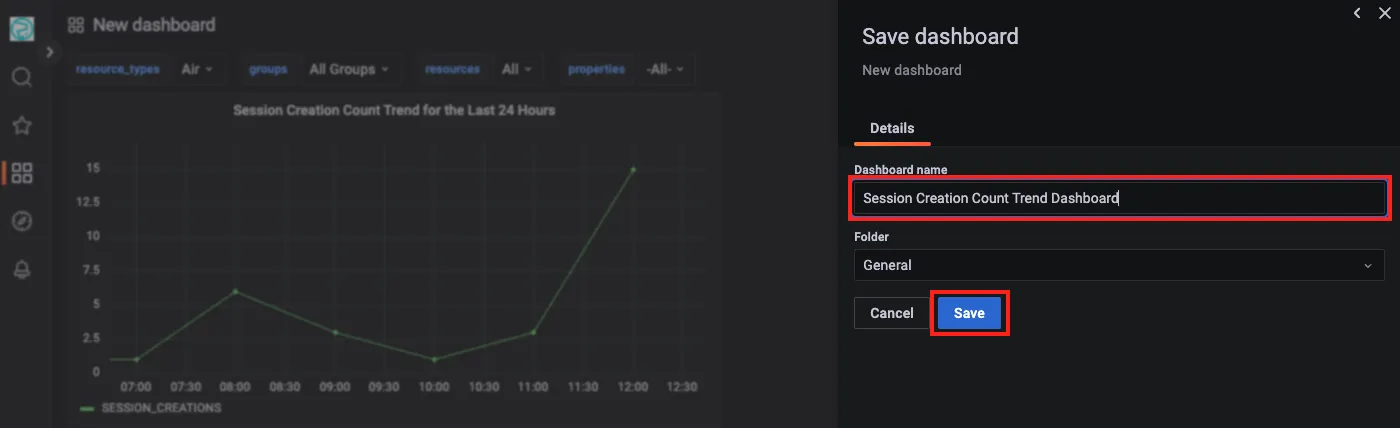
The Dashboard will be saved.