Using Query to Show Recent Connection Trends
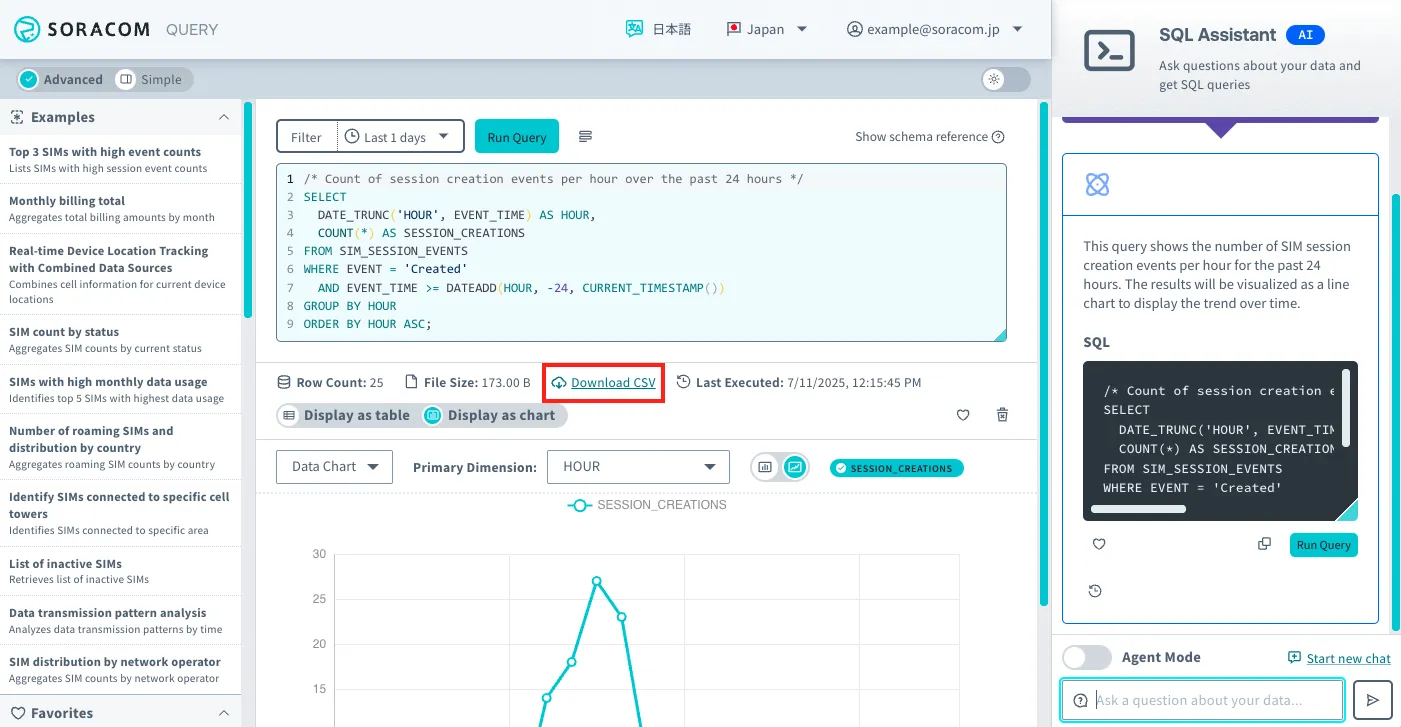
Use Soracom Query's AI (SQL Assistant) to display the trend of session creations over the past 24 hours.
Prerequisites
You must be subscribed to a Soracom Query plan. For details, see Plan Management.
Step 1: Access Soracom Query
-
Sign in to the User Console .
-
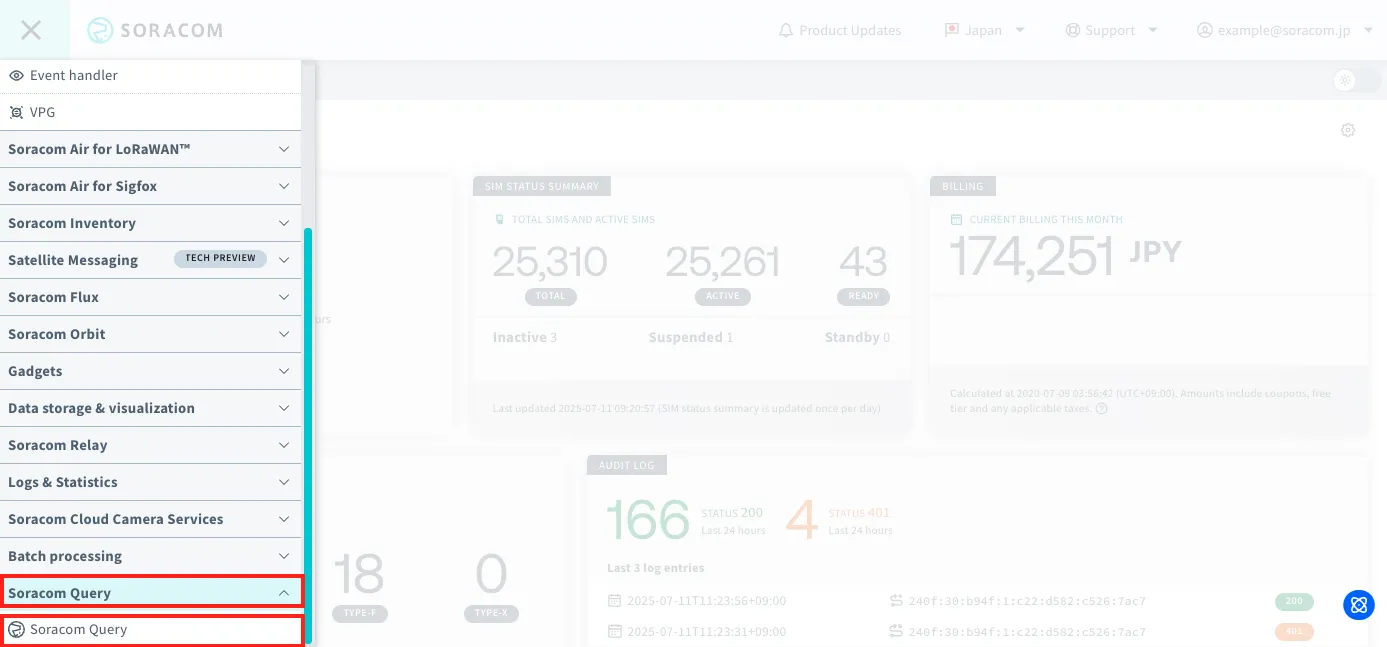
From the Menu, expand Soracom Query and select Soracom Query.
-
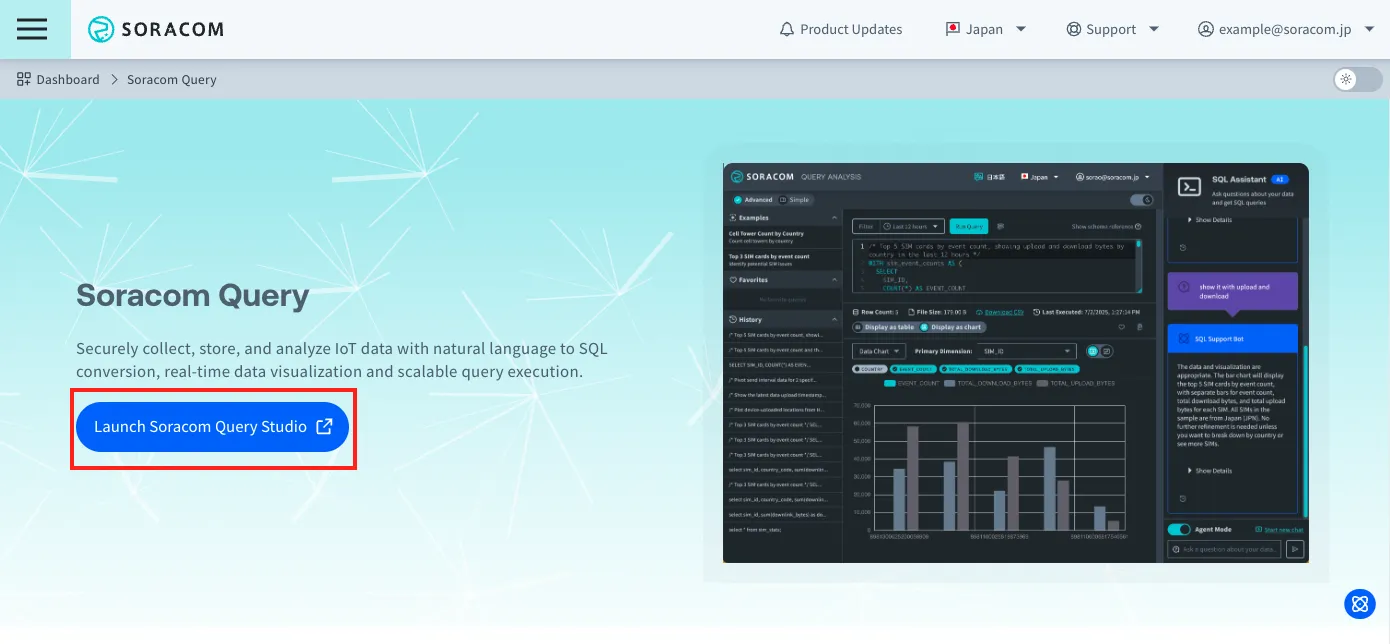
Click Launch Soracom Query Studio.
-
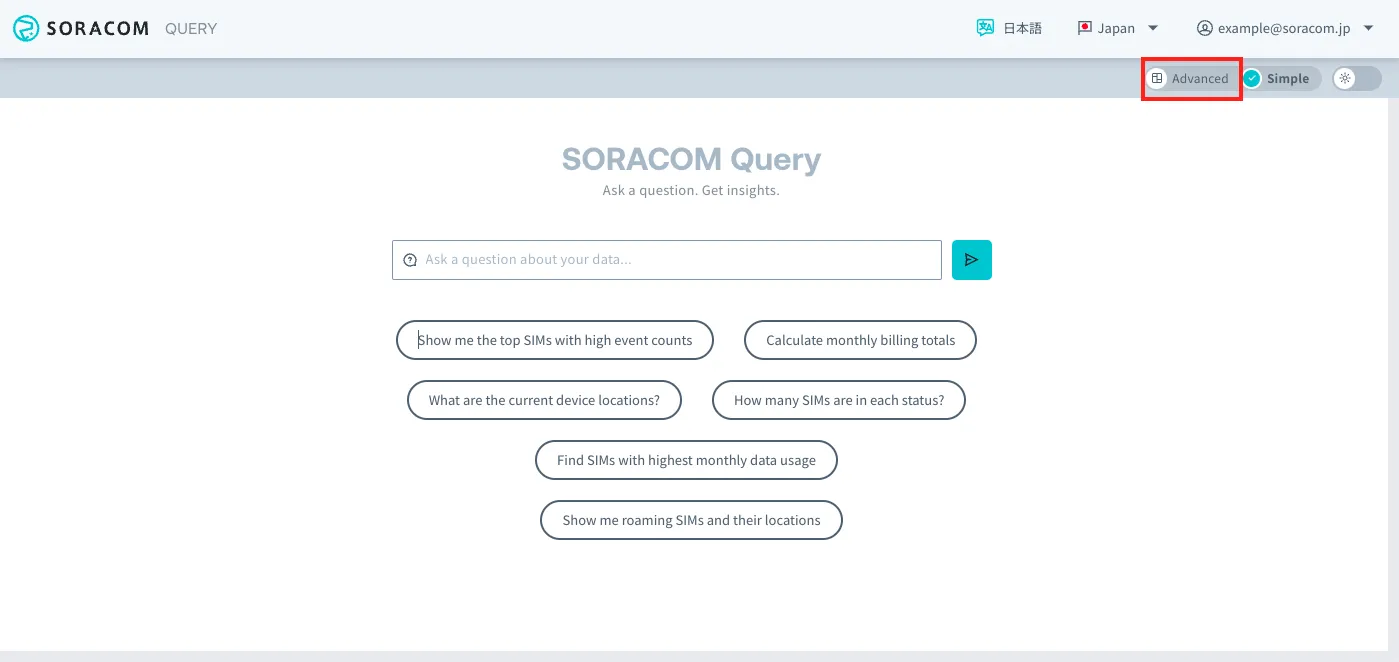
Click Advanced.
Step 2: Create a Query with SQL Assistant
-
Enter "Show the trend of session creation counts over the past 24 hours." in the input field at the bottom right of the screen and click Submit icon.
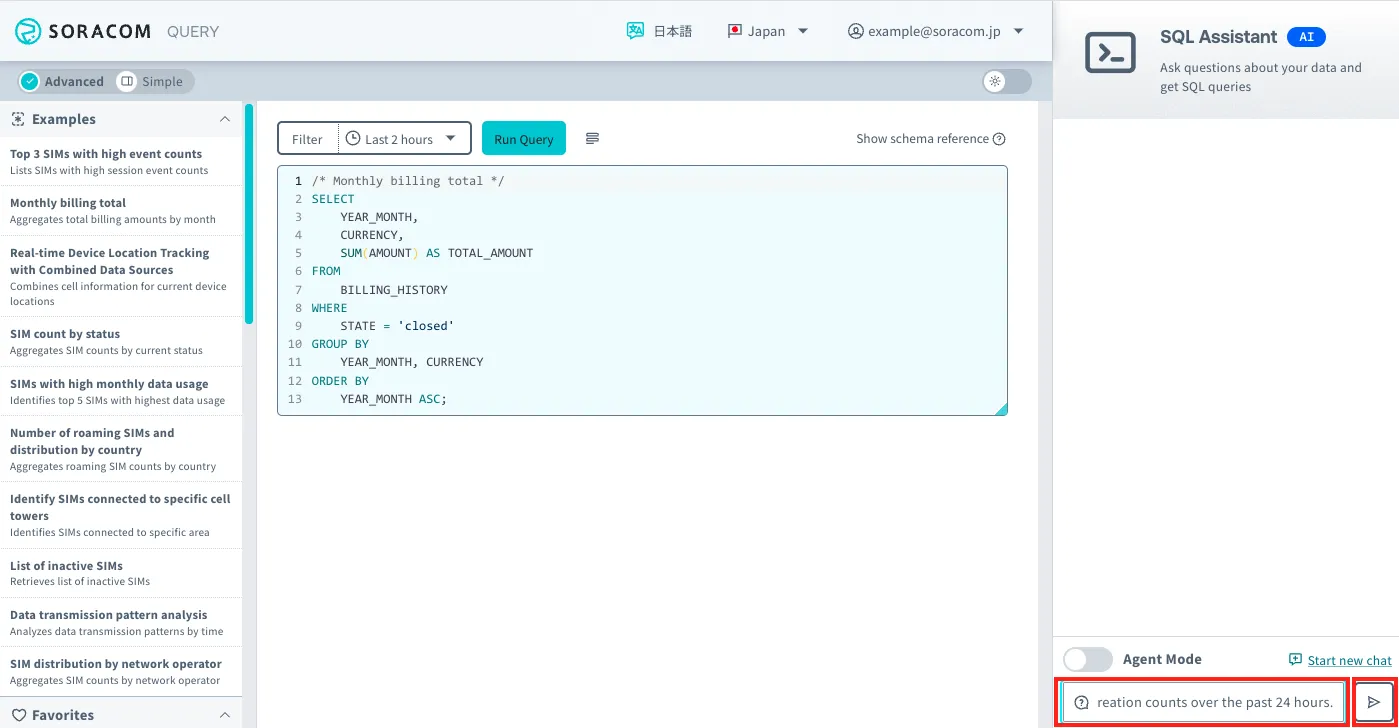
! Note that when Agent Mode is enabled, the SQL Assistant will automatically execute the query and attempt to adjust it automatically until it determines the results are correct.
-
When the SQL query is displayed, click Run Query.
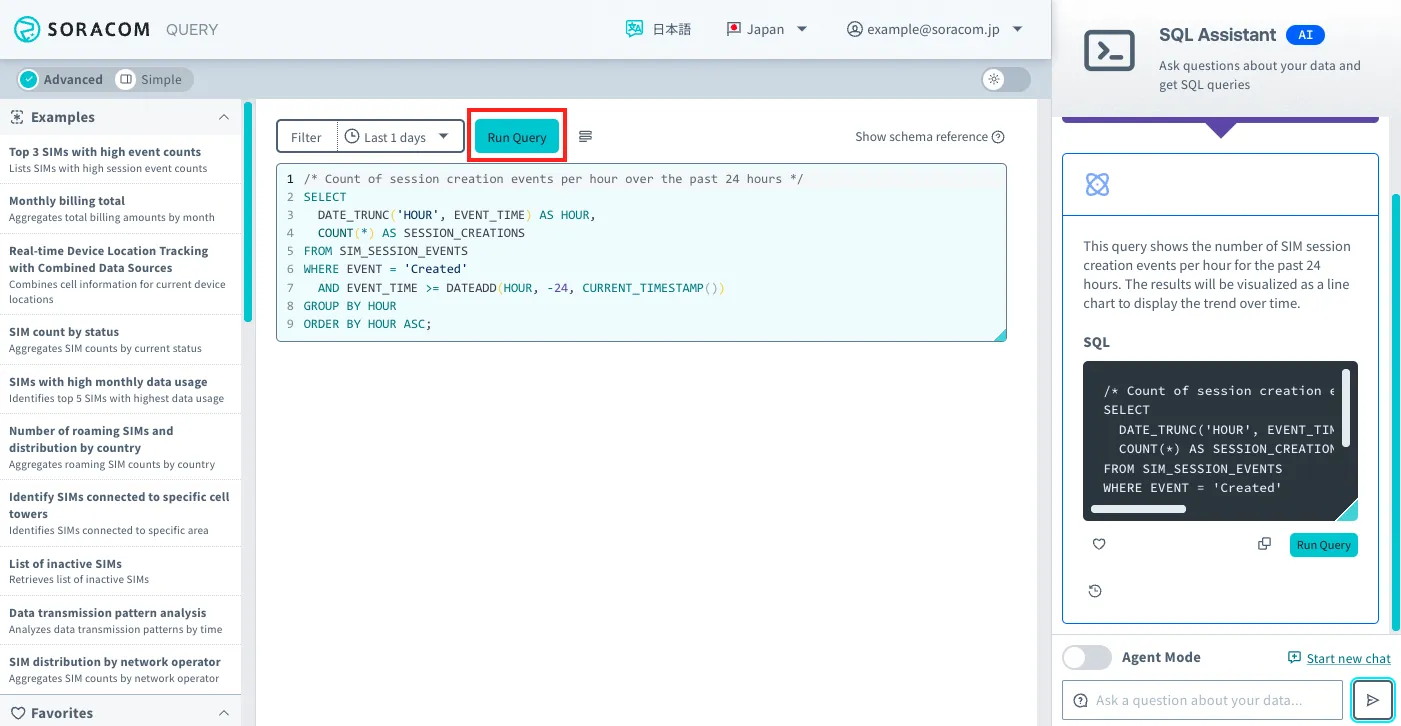
! The maximum character limit for SQL queries is 3,000 characters. ! ! If your SQL query exceeds 3,000 characters, an error will be thrown. If you have exceeded the limit, reduce the number of characters in your SQL query within the allowable amount.
The SQL execution results will be displayed.
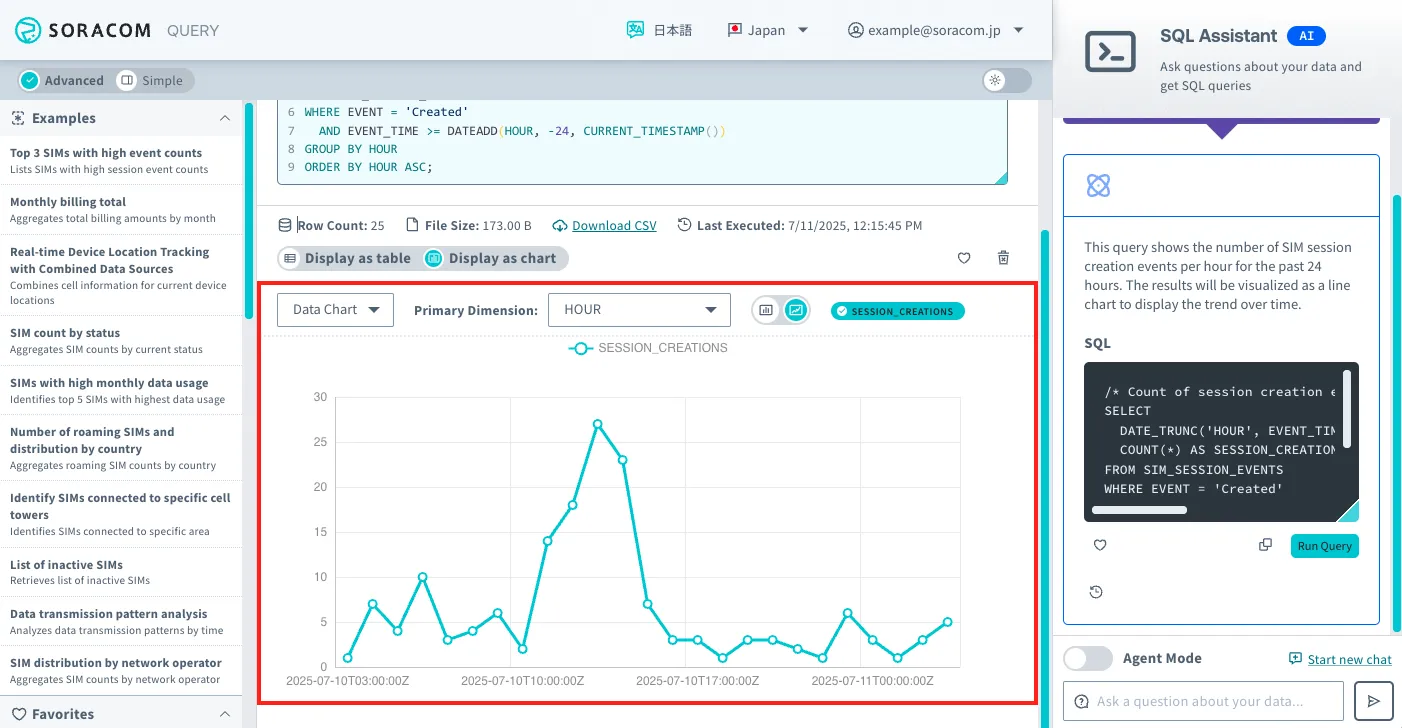
-
If you want to modify the displayed SQL query, enter your modifications and click Submit icon.
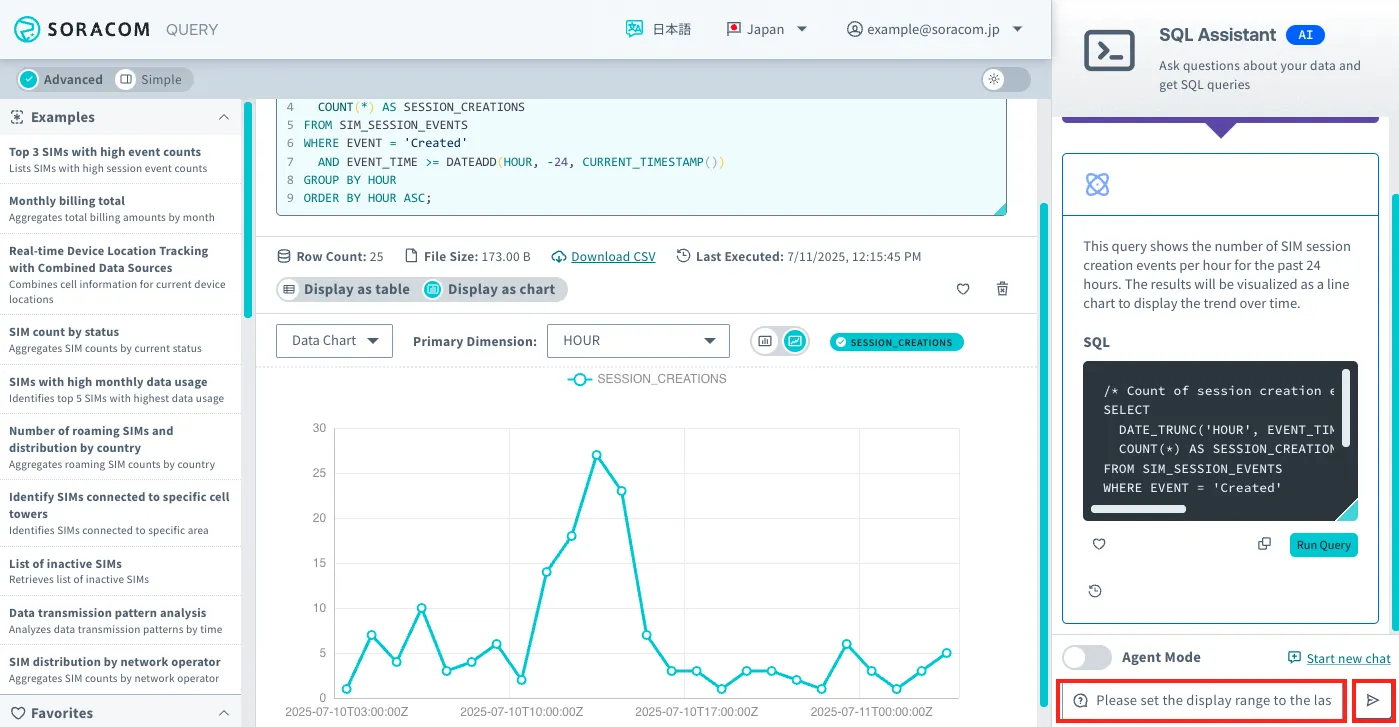
-
You can download the SQL execution results as a CSV file.